Bài mẫu IELTS Writing Task 1 các dạng mới nhất năm 2023
Bây giờ, chúng ta sẽ xem xét ngắn gọn bài mẫu IELTS Writing Task 1 các dạng và câu hỏi mẫu cho mỗi loại. Đừng lo lắng về điều này bây giờ vì Aten English sẽ chỉ cho bạn cách thực hiện việc này trong hướng dẫn từng bước.
Biểu đồ cột
Biểu đồ cột là câu hỏi rất phổ biến ở Task 1. Dữ liệu có thể được trình bày theo chiều dọc, như trong ví dụ bên dưới hoặc theo chiều ngang.
Đề bài: The bar graph below displays the number of seals, whales, and dolphins observed in the Gormez Straits between 2006 and 2018.
Summarise the information by selecting and reporting the main features, and make comparisons where relevant.
Write at least 150 words.
Biểu đồ cột
The figure shows the total number of three different species of fish—whale, dolphin, and seal—that were observed in Gormez Straits over a 12-year period ending in 2018.
Overall, it is evident that the dolphin population has increased throughout this time, whereas the whale population data has remained relatively stable.
As for whales and dolphins, it is evident that at the beginning of the inquiry, their numbers were the lowest of all the animals involved in the plan. In the meantime, this metric has increased dramatically since 2010 and peaked in 2018 at more over 50. Whales, on the other hand, did not see any notable expansion in their population. They were estimated to be about 25 in 2006, but their data fluctuated throughout time, and finally, with very little advancement, they were estimated to be about 28 in 2018.
What makes the seal picture stand out is that, at the beginning, seals had by far the largest society; by 2010, however, that number had leveled off at 25. In the latter stage, this trend skyrocketed to above 40.
Biểu đồ đường
Biểu đồ đường cũng rất phổ biến trong bài mẫu IELTS Writing Task 1 các dạng. Chúng dễ diễn giải hơn vẻ ngoài của nó.
Đề bài: The graph below projects population growth until 2050 and displays data for China and India as of the year 2000.
Summarise the information by selecting and reporting the main features, and make comparisons where relevant.
Write at least 150 words.
Biểu đồ đường
The graph displays the historical and projected demographic changes in China and India from 2000.
China was home to a larger population in 2000 than India. There were 1.25 billion Chinese people on the planet, compared to around 1 billion people in India. The number of Indian citizens increased by 0.2 billion between 2000 and 2010. China now has a population of about 1.35 billion, up 0.1 billion during the same time span.
The graph indicates that India’s population is expected to grow faster than China’s, and analysts predict that by 2030, the populations of the two nations would equal 1.45 billion. Following this, it is anticipated that India’s population would rise to 1.6 billion in 2050, while China’s population will likely decline somewhat to 1.4 billion.
India’s population is expected to expand steadily over the next 50 years, surpassing that of China. China’s population, on the other hand, will peak in 2030 and then start to decline.
Các bảng cũng xuất hiện thường xuyên trong Task 1. Một số học sinh cảm thấy khó diễn giải những bảng này hơn vì chúng chỉ là những tập hợp số không có hình ảnh minh họa. Tuy nhiên, chúng không phức tạp đến vậy.
Đề bài: With an estimated 2050 population, the tables below provide data on the world’s population and distribution in 1950, 2000, and 2050.
Summarise the information by selecting and reporting the main features, and make comparisons where relevant.
Write at least 150 words.
Bảng
The percentage of people and their distributions around the globe in 1950 and 2000 are compared in this table along with projected totals for 2050 across six distinct areas.
Overall, it is evident that although population growth is anticipated in Asia and Africa, population declines are anticipated in Europe and North America. One noteworthy aspect is that Oceania is probably going to stay steady for the duration of the question.
Asia had the largest percentage of any given distribution in 1950, at 56%, and is expected to gradually increase to 59% in 2050. However, there was a dramatic decline to 12% in 2000—roughly twice as low as 22% in 1950. In the end, a 5% decline in the proportion is anticipated in 2050. By 2000, the population of Latin America accounted for 6% of the global total, a marginal increase from the previous year, and is expected to remain stable by 2050.
In North America, the population was only 7% and 5%, respectively, in 1950 and 2000. Over the next 50 years, it will only slightly decline to 4%. Africa will still have increased from 9% to 20% by 2050, almost doubling.
Biểu đồ tròn
Mặc dù biểu đồ hình tròn không phổ biến như biểu đồ cột và biểu đồ đường trong bài mẫu IELTS Writing Task 1 các dạng, nhưng bạn cần biết cách trả lời loại câu hỏi này trong trường hợp bạn gặp phải câu hỏi này.
Đề bài: The graph below illustrates the reasons why individuals drive or ride their bikes to work.
Summarise the information by selecting and reporting the main features, and make comparisons where relevant.
Write at least 150 words.
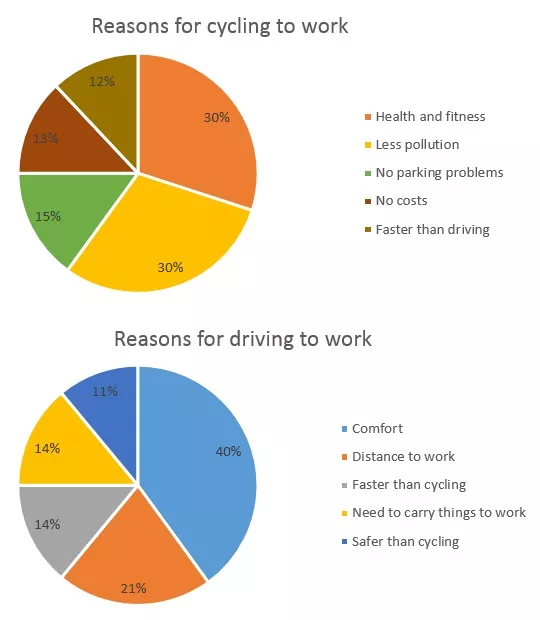
The first graphic outlines the motivations for the choice of certain UK citizens to commute by bicycle. On the other hand, the second chart explains why some people decide to drive themselves to work.
The majority of those who support cycling claim that this is because it’s healthier to bike rather than drive to work. This was cited by 30% of them as a cause. Thirty percent of the same persons claim to cycle to work because it reduces pollution. 13% of commuters choose to bike rather than drive to get to work. Remarkably, a comparable number of respondents claimed to pedal rather than drive to work as it’s faster.
On the other hand, 40% of people say they prefer driving because it’s more pleasant. The two least compelling arguments against taking the automobile to work are that it is safer than riding a bicycle and that individuals must carry items to work, with 14% and 11% of respondents, respectively. Lastly, 16% of respondents claim that driving is faster than cycling. This is in contrast to the bikers who commute by bike as it’s quicker than driving a car.
Most people who bike to work appear to do so for environmental and health-related reasons. Those who drive, on the other hand, desire a more pleasant ride over greater distances.